| |
 Graduate Student Profile Graduate Student Profile |
|
|
Graduate Students by Gender |
|
|
|
|
|
|
|
 |
|
|
|
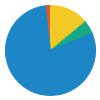
Graduate Students by Race/Ethnicity |
|
|
|
 |
 |
American Indian |
|
 |
Asian or Pacific Islander |
|
 |
Black |
|
 |
Hispanic |
|
 |
White |
|
 |
International Student |
|
|
|
|
|
|
|
|
|
Graduate Students by Age |
|
|
|
 |
|
Under 25 |
|
|
Age 25 - 29 |
|
|
Age 30 - 34 |
|
|
Age 35 - 39 |
|
|
Age 40 & over |
|
|
|
|
|
|
|
|
|
Graduate Students by Attendance Status |
|
|
|
 |
|
Full-Time Students |
|
|
Part-Time Students |
|
|
|
|
|
|
| |
|
|
| Enrollment |
|
|
| |
| Student Services |
|
|
Counseling Services  |
 |
|
| Employment Services |
|
|
| Placement Services |
|
|
| On-Campus Day Care |
|
|
| Library System |
|
|
|
|
|
|
|
| |
|
|


